I’ve now been using AWS EKS for about three months in production, where it hosts the multiple Ageras websites and our API. Before this move our infrastructure was a bunch of virtual machines where we had our services deployed, and we could manage and tweak a lot of settings of the various services we used (i.e. Elasticsearch, Redis, MySQL, Beanstalkd, Haproxy, etc.). On one of our VMs we had already Docker containers running, so containers wasn’t a completely new thing.
Since we moved our production environment to Kubernetes, we’ve had a few outages; 1) the EC2 instances within the cluster ran out of disk space, and 2) we noticed a very sudden increase in CPU load on the cluster and our RDS instances, possibly due to incorrectly set CPU limits. Now that we’ve moved to using some beefier EC2 instances, the load remains stable.
Experience running AWS EKS in production for three months
Let’s get the expectations clear from the start, this isn’t a post about how to set things up in detail. I will share some information and parts of our configuration together with our reasons to do it in that way, yet this article is mostly about what we’ve learned.
We’re running two Laravel applications that respectively run our website and our API. We’re using a few data sources, such as a MySQL database, Elasticsearch for searching and Redis for cache. These components have been part of our applications for a few years, and they’ve been reliably working so far on VMs. Why change it then, right? Well, we wanted to move to a more scalable hosting solution like AWS, and why not then consider moving to containers instead of VMs? Running containers needs some orchestration, and it was fairly straightforward to setup a Kubernetes cluster in AWS using their EKS platform.
Use read-replica database instances
Read-replicas of the primary database can be a nice solution to take some load away from the primary database, though you should think it through. Let’s first provide some context; we have an application where we can perform CMS actions on our website, and the actual website is just reading the given data. However, the website project is still in control of it’s own data model and database.
I thought it was a good idea to let the website run of the RDS read-replica database instance, and in the past month or so this was a good idea to keep load of our primary database. However, I never considered that we’d be updating the database actually from within the project itself. Oops! The init container that runs the migrations is now acting specifically on the primary RDS instance, and the actual containers are acting on the read-replica RDS instance.
This above statement that I published in our own company’s Slack channel says it all, and also provides a solution for the problem when you use initContainers within your Kubernetes setup. This configuration is possible through setting the correct environment variables within the container. Happily it didn’t create any downtime for our application, as applying the new deployment failed without taking down the existing containers.
I’ve found that the replication lag between the primary and the replica is negligable in most cases, though you should be aware that there is a lag that can be multiple seconds.
Deploying containers without downtime
In an environment where you’re working with VMs, you’d usually deploy your changes server by server in sequential order, likely creating some small moment in time where the server might be down or serving HTTP 500 errors. Within Kubernetes it is straightforward to deploy a new version of your application before taking down the older version. We’re running three replicas of the application container side by side, and when we want to deploy a new version Kubernetes will take care of doing that in a rolling fashion. The configuration shown here defines that we want at most one single application container to be unavailable, and that we want to have at most one single container added on top of the replica count during deployment.
  replicas: 3
  strategy:
    type: RollingUpdate
    rollingUpdate:
      maxUnavailable: 1
      maxSurge: 1
This strategy works quite well for our application, and enables the application to continue to serve requests without downtime due to a deployment.
Experiment with resource requests and limits
As I mentioned in one of the first paragraphs, we had some issues in keeping our application stable under load, and that the CPU usage spiked without a clear reason. This may have been related to a combination of having too small machines hosting the cluster and that I’ve setup Kubernetes resource limits too strict. A colleague mentioned, after overhearing me speak about it, that there is an issue in Kubernetes with CPU limits that could cause unneeded throttling 1. So far the fix for us is to not set limits to CPU resources within your containers, and according to the comments made in the Github issue and on Twitter it seems to be what all the other companies are doing.
We have reduced 75 percentile response time over all apps from 150ms to 90ms after disabling CFS quota (CPU limits) on one of our #kubernetes cluster - #KubeCon learning by @try_except_ pic.twitter.com/KdlRiapaL2
— Thomas Peitz (@tpeitz_dus) May 29, 2019
That's exactly what @ZalandoTech does: no memory overcommit and no CPU throttling https://t.co/e0IfTGsMBd https://t.co/xyUOIG6cgS
— Henning Jacobs (@try_except_) May 30, 2019
This fix may not always be a good solution in multi-tenant environments, though it did help us.
Implement monitoring & observability
“In the world of software products and services, observability means you can answer any questions about what’s happening on the inside of the system just by observing the outside of the system, without having to ship new code to answer new questions.” Honeycomb.io
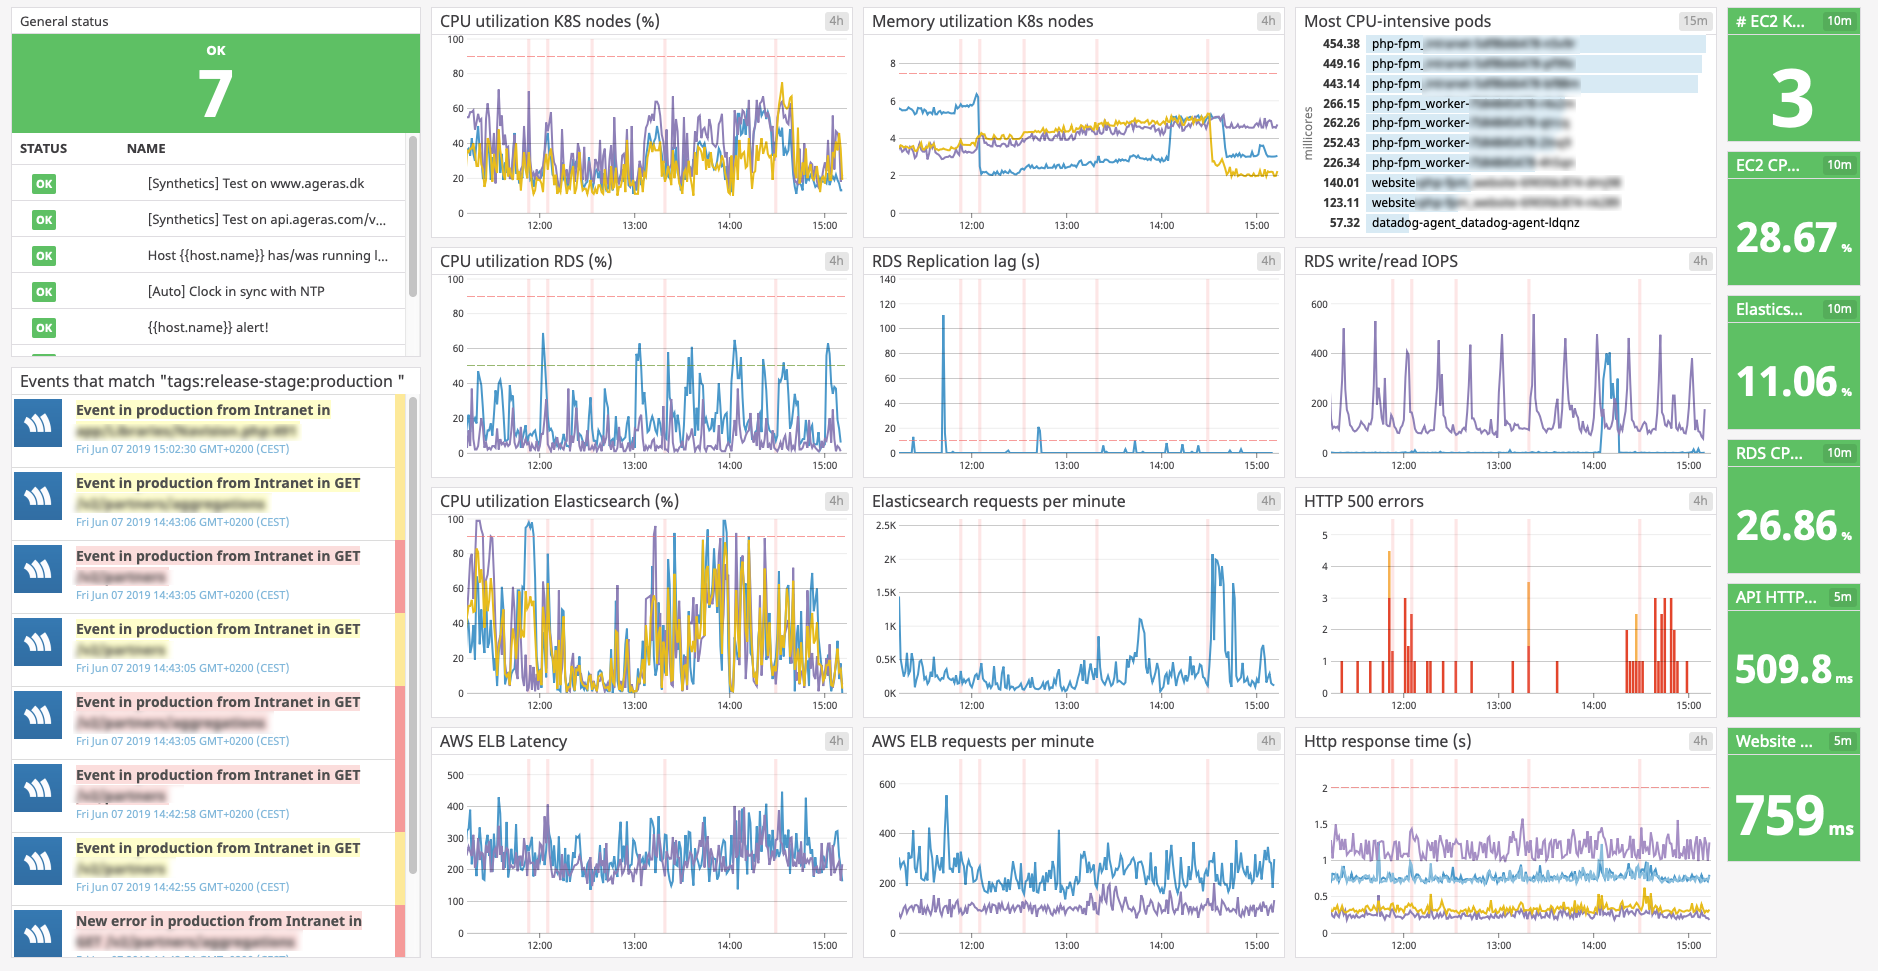
This above quote comes from the founder of Honeycomb.io, and is a really nice definition. Although I don’t actively use their software, I still find it something worth aspiring too. That being said, within the team we do have a dashboard for monitoring the performance of our application and Kubernetes cluster. The dashboard includes CPU and memory utilization of the EC2 instances that serve the cluster, CPU and memory utilization of our RDS cluster, as well as HTTP 500 errors, number of requests per minute to our load balancers and the result of response time tests. You can see an example below of our dashboard within Datadog.
The take away that I have from creating this dashboard is that you should iterate, and see if the values you’re showing make sense for you.
Learn to use tooling
There is a world of tooling available for Kubernetes, some very specific and some very broad.
Tools I use daily:
kubectl; the default CLI tool for Kubernetesstern; follow logs of multiple containerskubectx; switch easily between our test cluster and productionk9s; a nice interface for quick interaction with running containers
Wrapping up
All in all, I’m pretty happy with our AWS EKS cluster and I like Kubernetes as orchestrator. Rollbacks of deployments is very easy to do with kubectl rollout undo deployment/your-application if you really need to, as long as you keep a history of at least 1 container image in your deployment. I also like the fact that you can move to new EC2 instances without downtime quite straight forward, by cordoning off your existing nodes, and moving your containers to new nodes.
The thing is that this setup can start costing quite a lot on AWS, though the majority of our bill is fed by very beefy multi-AZ RDS instances. So for personal projects, like this website, I’ll still use a single VM.
-
Github issue describing the problem: https://github.com/kubernetes/kubernetes/issues/67577 ↩
P.S. If you’ve enjoyed this article or found it helpful, please share it, or check out my other articles. I’m on Instagram and Twitter too if you’d like to follow along on my adventures and other writings, or comment on the article.
 Buffer
 Tweet
Tweet Share
Share